In one line
Open interest (OI) is the combined value of all contracts not yet closed. Every contract has one long and one short, so long OI always equals short OI, and OI on its own has no direction. What it tells you is how much contract money is riding on a token, and whether that pile is growing or shrinking.
How open interest changes
- Both sides open: a new long trades with a new short, and OI rises;
- Both sides close: a long who wants out trades with a short who wants out, and OI falls;
- One opens, one closes: a new long takes over the position of a departing long, and OI is unchanged;
- Liquidation: a position without enough margin is closed by the exchange, and OI falls.
So a big jump in OI means a lot of new positions are opening; a big drop means a lot are leaving, whether by choice or by liquidation.
How to read it: four combinations of price and OI
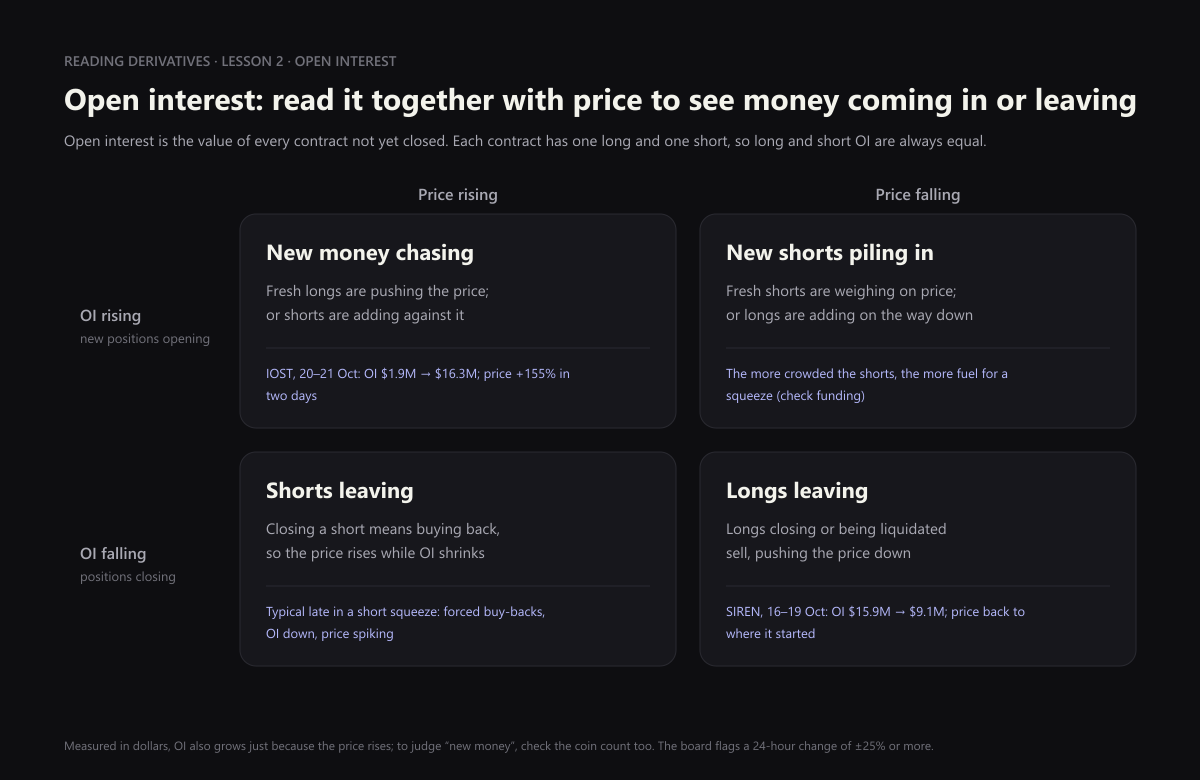
| OI rising | OI falling | |
|---|---|---|
| Price rising | New money chasing: fresh longs are pushing the price, or shorts are adding against it | Shorts leaving: closing a short means buying back, so the price rises while OI shrinks; typical of a squeeze |
| Price falling | New shorts piling in, or longs adding on the way down | Longs leaving: longs close or are liquidated, and their selling pushes the price down |
Every cell says “or”, because OI only tells you whether positions are opening or closing, not who started it. To see which side is in the driving seat, check funding (who pays) and long/short ratios (who stands where).
Two details:
- Dollars versus coins: the board and exchanges usually show OI in dollars. If the price doubles, the same contracts are worth twice as much in dollars. To judge “new money”, check the coin count as well.
- Compare it with spot: $10M of OI means nothing on bitcoin, but on a token whose spot trades a few million dollars a day it is enough to move the price around (see lesson 4).
Real case: SIREN’s round trip
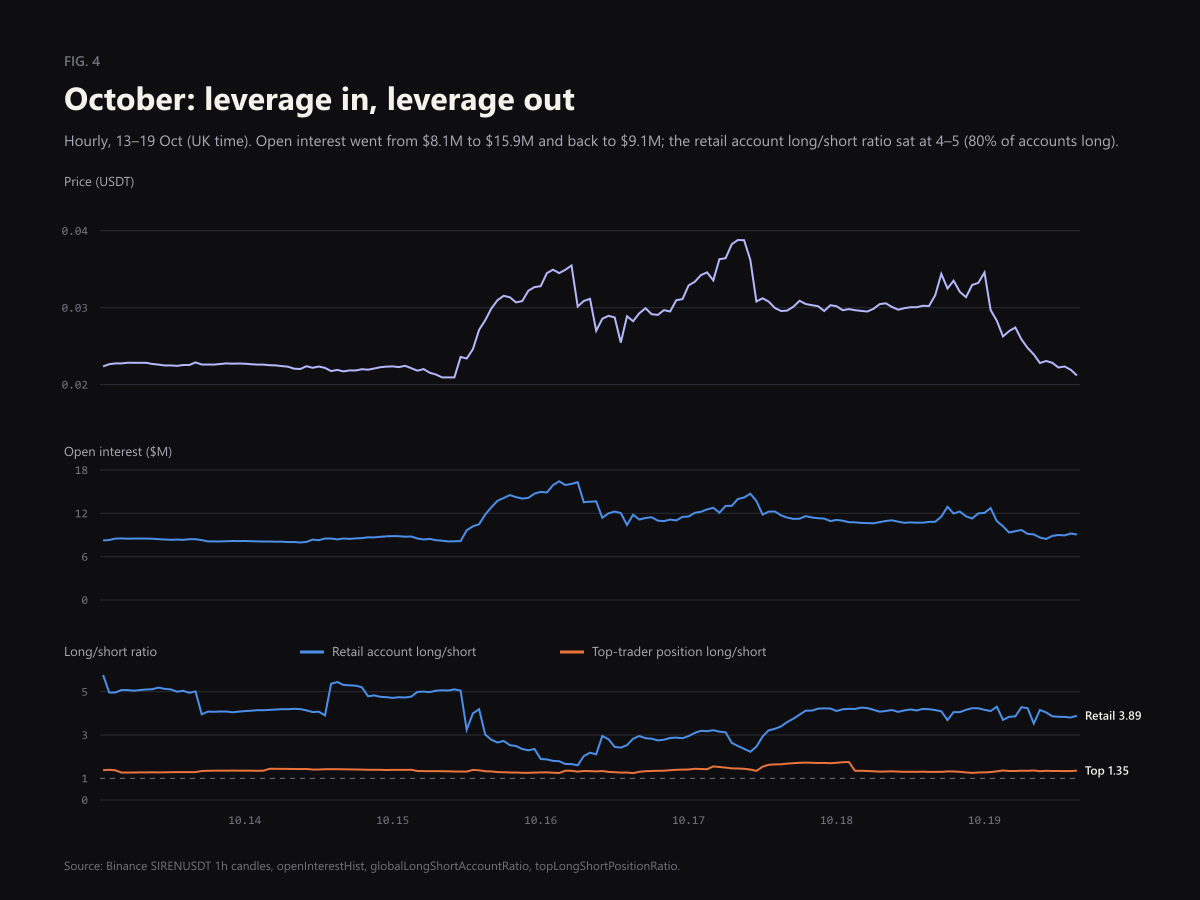
In October, issue 004, SIREN, OI and price made the same round trip:
- about $8.1M of OI before the move;
- $15.9M on 16 October as the price doubled, the “new money chasing” cell;
- back to about $9.1M as the price fell to where it started, the “longs leaving” cell.
On the day the price fell 38%, the largest single on-chain seller sold only about $50,000. The round trip came mostly from contract positions opening and closing; it did not need anyone to buy or sell much spot.
Two other issues show the same pattern:
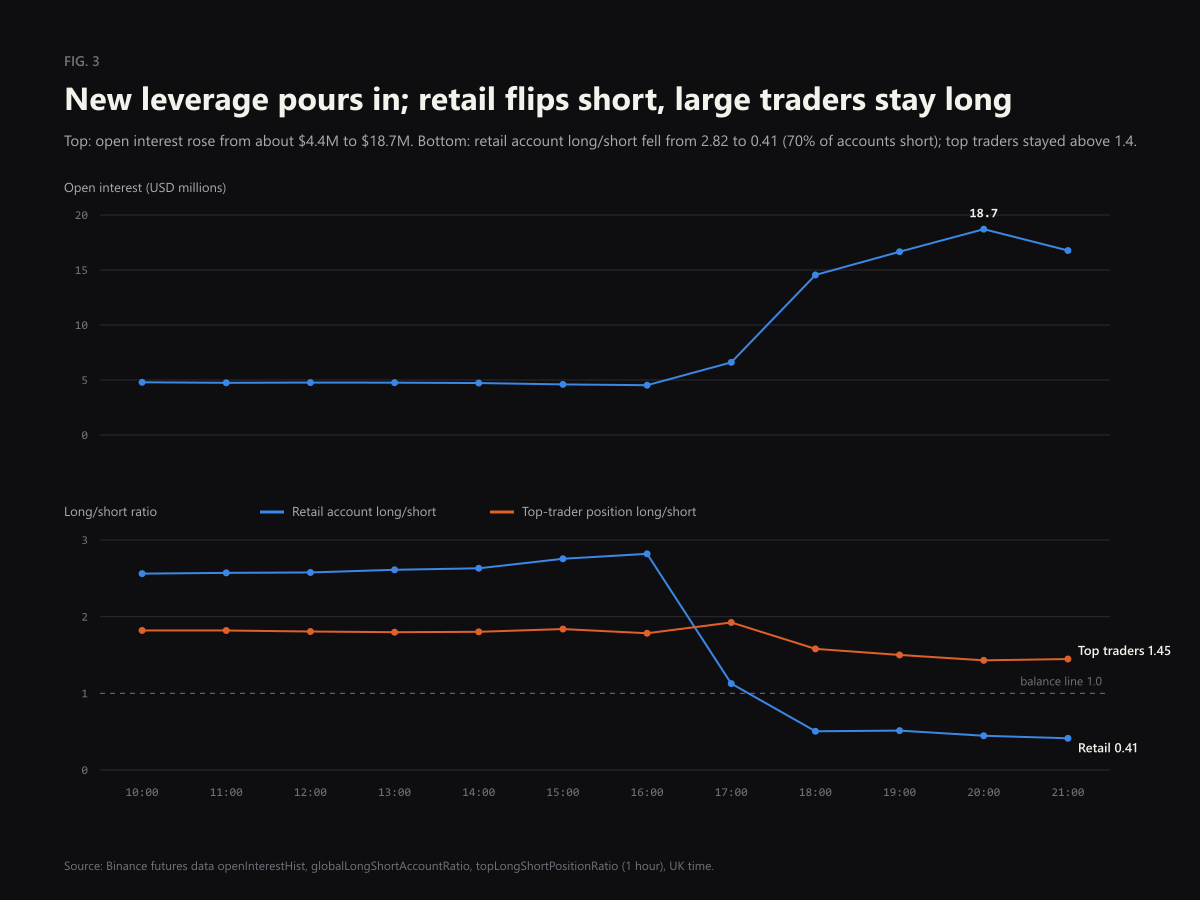
- AGT doubled in two hours on 15 October as OI went from about $4.4M to $18.71M; the next night, another spike took OI from $31M to $49.3M before it eased back to $36.9M a few hours later.
- IOST OI sat around $1.9M until 11:00 on 20 October, then climbed to $16.3M, about 8.5 times, as the price rose 155% in two days.
Common mistakes
- “Rising OI means longs are coming in.” Every new contract has a long and a short. Rising OI only means both sides are adding; which side is more eager shows up in funding and the long/short ratios.
- “Falling OI is bearish.” Not necessarily. A sharp price rise with a sharp OI drop is often shorts being liquidated; the falling OI and the rising price are the same event.
- “The bigger the OI, the more people like the token.” Big OI only means a lot of leveraged money is riding on it. The bigger OI is relative to spot, the more perp money sways the price, and usually the wilder the swings.
Now look at the board
On the derivatives board, the crowding map’s vertical axis is the 24-hour change in OI: higher means more positions opening, lower means more leaving. Tokens that move ±25% or more in 24 hours are flagged. Read it together with funding on the horizontal axis and you have a live version of this lesson’s four-cell chart.
In short: OI has no direction of its own. Price up with OI up is new money arriving; price up with OI down is usually shorts being forced out.
This article only explains what the measure means and how to read it. It is not investment advice and makes no buy, sell, leverage or position-size suggestions.
The board refreshes every 15 minutes and the wallet tracker every hour. Both describe the market only and never suggest a trade.