In one line
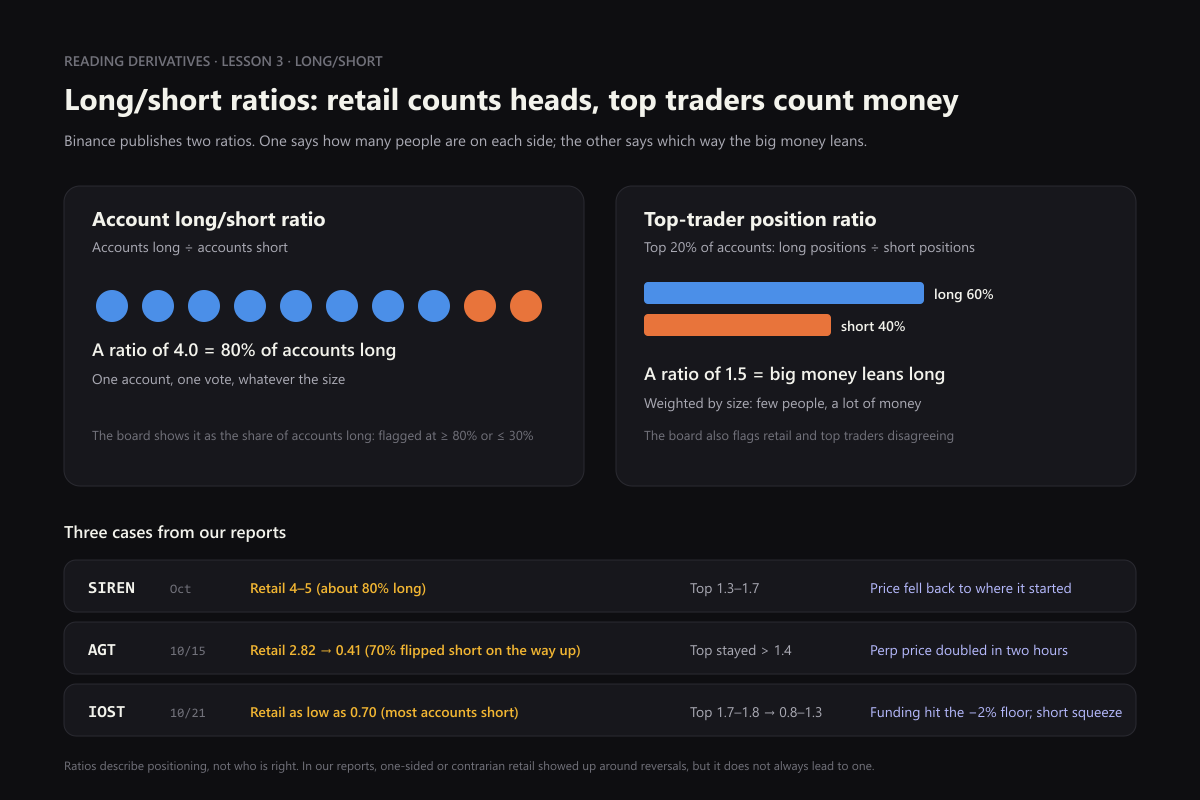
The last lesson said long OI always equals short OI. So what does a long/short ratio compare? How the people, or the money, on each side are distributed. Binance publishes two:
- Account ratio: accounts long ÷ accounts short. One account, one vote, whatever the size. The board calls this “retail”.
- Top-trader position ratio: among the top 20% of accounts by margin, long positions ÷ short positions. Weighted by size: few people, a lot of money. The board calls this “top”.
Converting the ratio
The account ratio is easier to read as the share of accounts that are long:
| Account ratio | Share of accounts long |
|---|---|
| 4.0 | 80% |
| 2.0 | 67% |
| 1.0 | 50% |
| 0.43 | 30% |
| 0.33 | 25% |
The formula is share = ratio ÷ (1 + ratio). The board shows this share.
How to read it
- Retail on one side: when 80% or more of accounts are long, or 30% or fewer, the board flags it. When most people crowd one side, the other side is often a few large positions.
- Retail against big traders: most accounts long while top traders lean short, or the reverse, is also flagged.
- Watch the change, not just the level: a ratio that drops from 4 to 1.6 in a few hours says more than one that has sat at 1.6 all along; many accounts are switching sides fast.
- Combine it with the other two: the ratios show positioning, funding shows who is spending, and open interest shows whether positions are opening or closing. Only together do they tell you who is being squeezed.
Real case: AGT, where 70% of accounts flipped short on the way up
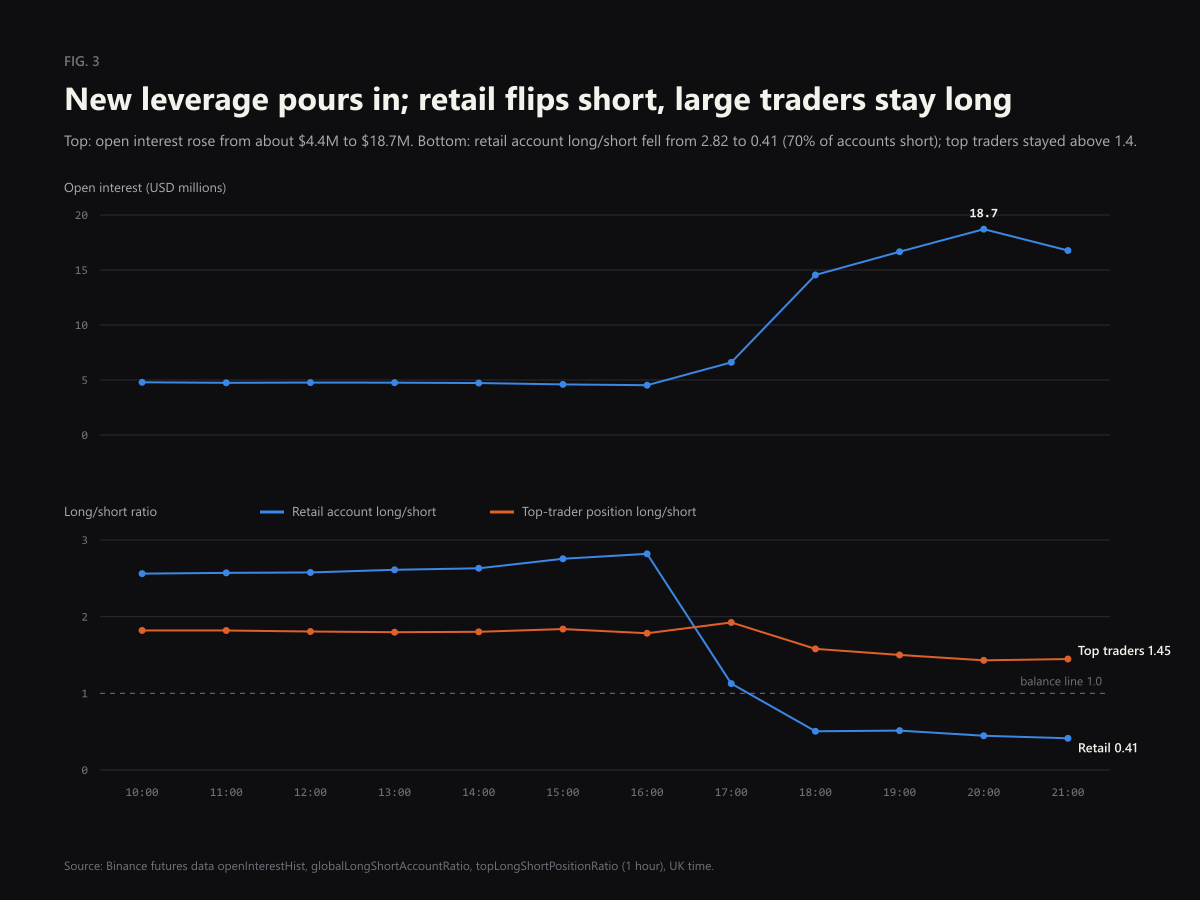
On 15 October, in issue 001, AGT, the perp went from 0.0152 to 0.0325 in two hours:
- the retail account ratio fell from 2.82 to 0.41, i.e. accounts long went from about 74% to about 29%: seven in ten accounts flipped short on the way up;
- the top-trader position ratio stayed above 1.4 throughout, so the big money leaned long;
- OI rose from about $4.4M to $18.71M at the same time.
Retail chasing the short side, big traders leaning long and OI exploding is exactly the “retail against big traders” case on the board. At 20:34 the next evening AGT spiked 21% in one minute; the retail ratio was about 0.33 (most accounts short) and the top ratio about 1.18, a shape that looks like shorts being liquidated together. Binance does not publish individual liquidations, so this cannot be confirmed directly.
The opposite case: SIREN, with 80% of retail long
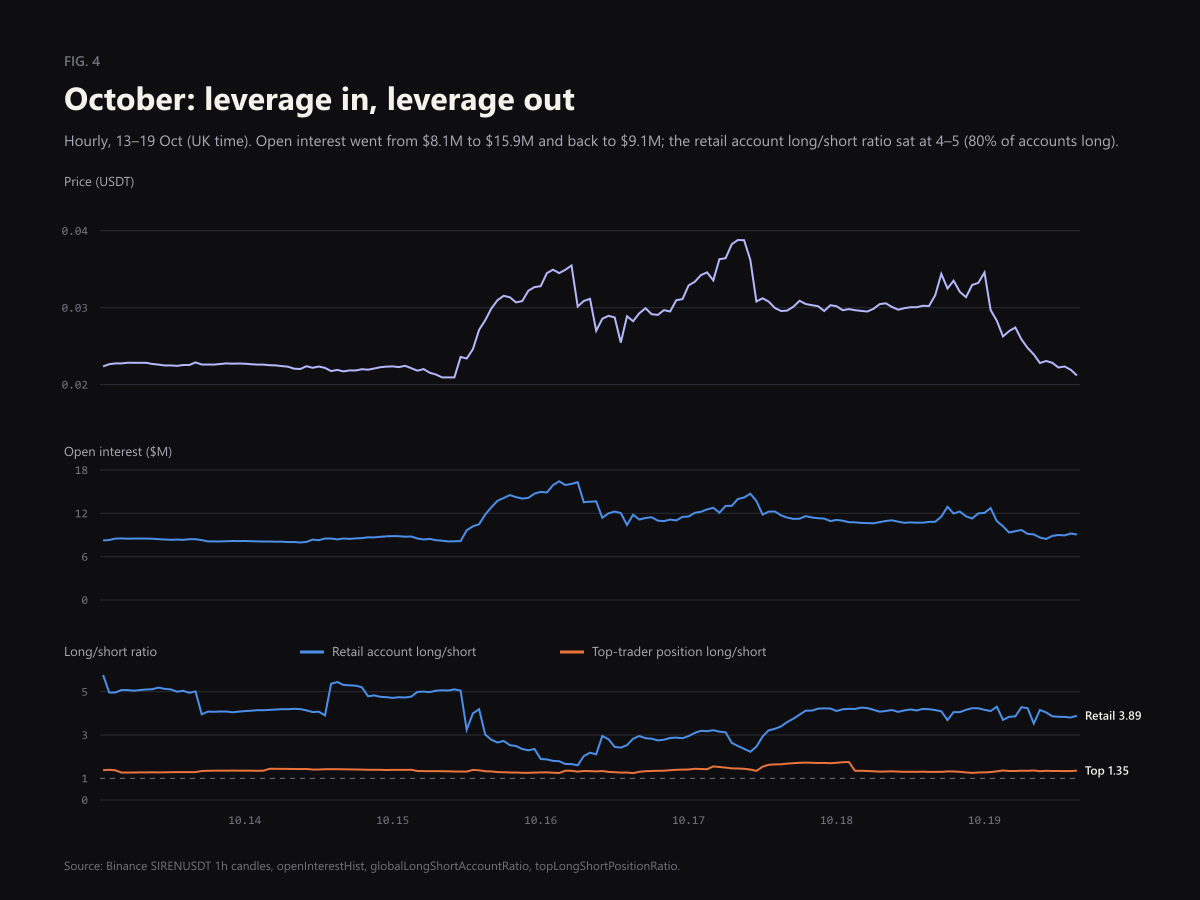
Issue 004, SIREN, went the other way:
- before the move, the retail ratio sat at 4–5 for a long time, about 80% of accounts long;
- during the rally it dropped to 1.66, retail chasing the short side;
- as the price fell back it returned to about 4, retail buying the dip;
- the top-trader ratio stayed at 1.3–1.7 throughout.
The price ended where it started. Retail went short during the rally and long during the fall, both times against where the price went next. Retail switching sides in sharp moves, and landing on the wrong side, is something we have seen again and again across our reports.
Common mistakes
- “Big traders lean long, so follow them.” The top-trader ratio only shows the perp positions of the top 20% of accounts. They may hold the opposite in spot and use the perp as a hedge; it is not a direction.
- “A ratio of 1 means the market is balanced.” An account ratio of 1 only means as many accounts are long as short. The money can still be heavily on one side.
- “One-sided retail always reverses.” No. One-sided means crowded, and crowding can last a long time. In our reports it often shows up around reversals, but not every time.
Now look at the board
On the derivatives board, the “Retail long · top” column holds this lesson’s two numbers: the share of accounts long, then the top-trader position ratio. Values past the threshold, or sides that disagree, turn amber; open a row for a plain-language explanation.
In short: the account ratio counts heads, the top-trader ratio weighs money. When people crowd one side, or people and money stand on opposite sides, it is worth a second look.
This article only explains what the measure means and how to read it. It is not investment advice and makes no buy, sell, leverage or position-size suggestions.
The board refreshes every 15 minutes and the wallet tracker every hour. Both describe the market only and never suggest a trade.